This describes how to use M3d to post process results from a Nastran Finite Element model.:-
1) Unzip the downloaded package to a suitable location;
2) Double click the M3da.exe application file to start M3d and
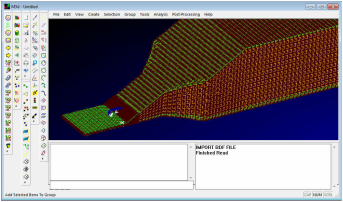
3) From the File menu select File->Import->DAT and select the RAMP_COMPOSITE.bdf file supplied with the package.
The model shown right should be displayed in the M3d modellers main window. This model is comprised of shell and solid elements. The shell elements are the composite skin and the solid elements are the honeycomb core of a composite panel. The shell element are multi-layered laminate elements.
1) Unzip the downloaded package to a suitable location;
2) Double click the M3da.exe application file to start M3d and
3) From the File menu select File->Import->DAT and select the RAMP_COMPOSITE.bdf file supplied with the package.
The model shown right should be displayed in the M3d modellers main window. This model is comprised of shell and solid elements. The shell elements are the composite skin and the solid elements are the honeycomb core of a composite panel. The shell element are multi-layered laminate elements.

To make the Finite Element model easier to see:-
click this icon on the 'Draw' toolbar to toggle off node visibility.
click this icon on the 'Draw' toolbar to toggle off node visibility.

click this icon on the 'Draw' toolbar to toggle off shell element thickness display. |
|

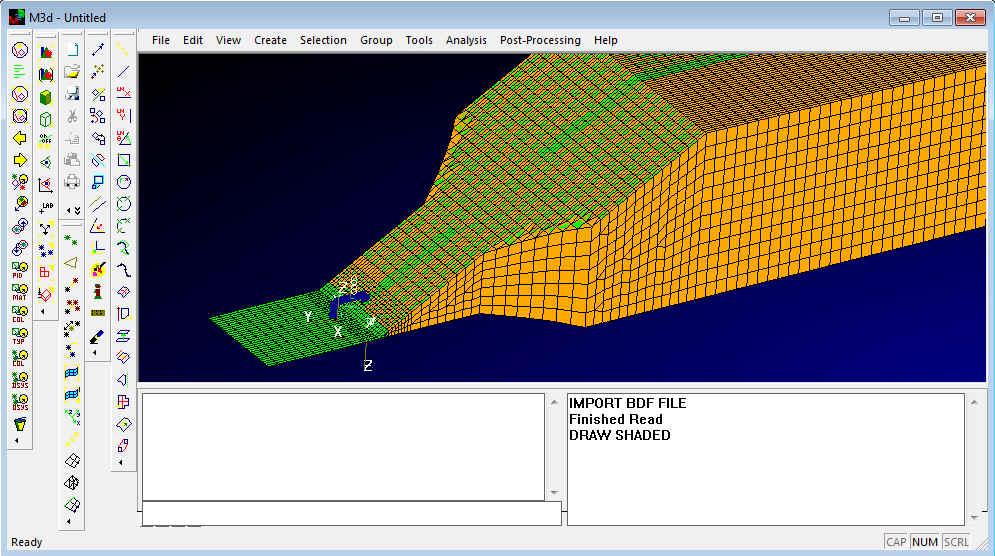
click this icon on the 'Draw' toolbar to view the Finite Element in shaded mode.

To load the results from the Nastran OP2 file from the File menu select 'File->Import->OP2' and select the ramp_composite.op2 file supplied with the package.
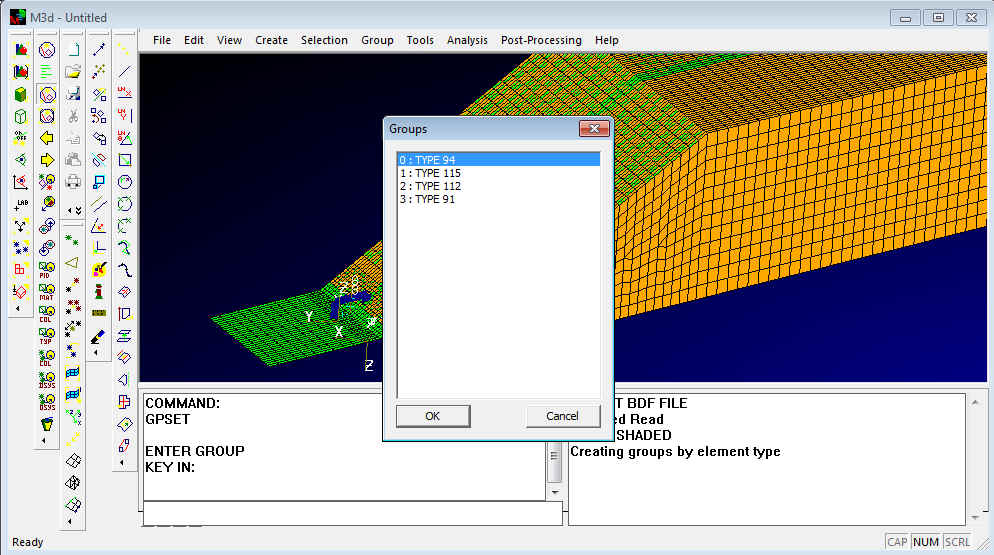
We are now going to create groups of elements based on their type
from the 'Groups' toolbar click this icon to create groups of element by type.
We are now going to create groups of elements based on their type
from the 'Groups' toolbar click this icon to create groups of element by type.

click this icon to see the list of created groups and select the group 'TYPE 94' the quad elements.
|
|

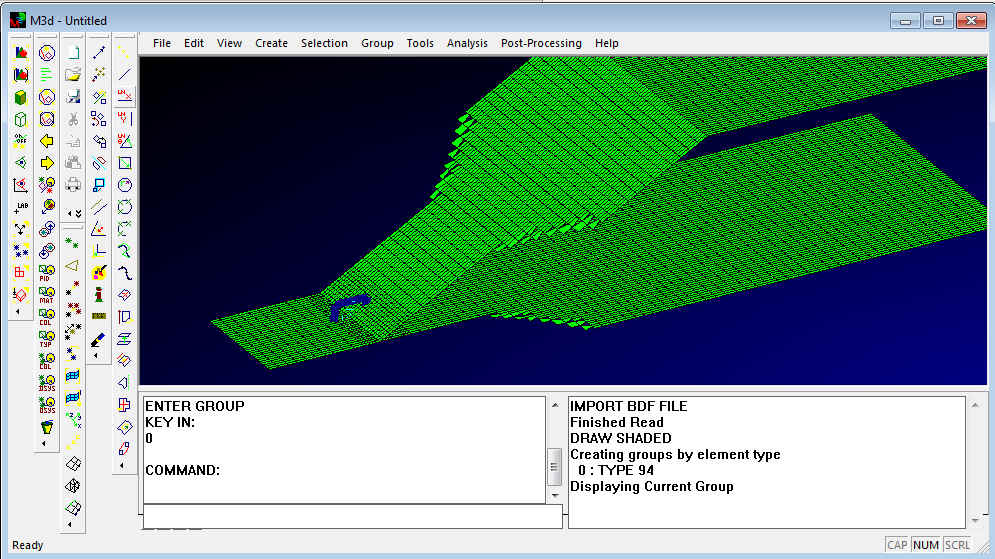
click this icon on the 'Groups' toolbar to display the currently selected group as shown right.
|
|

click this icon on the 'Draw' toolbar when you wish to re-display the whole model.
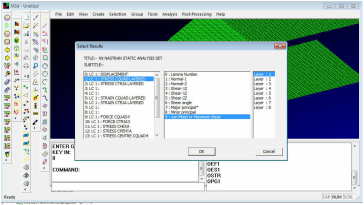
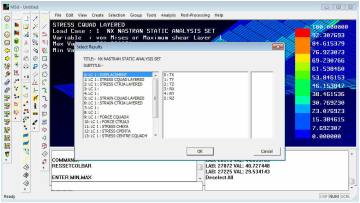
To set the results contour display go to the 'Post Processing->Select Contour Results' menu item. This brings up a dialog box with all the results that have been read from the Nastran OP2 file as shown right.
Select the items shown right in the dialog box and click ok.
Note: M3d may seem to hang for a short period of time while it attaches the results to the elements or nodes.
Select the items shown right in the dialog box and click ok.
Note: M3d may seem to hang for a short period of time while it attaches the results to the elements or nodes.
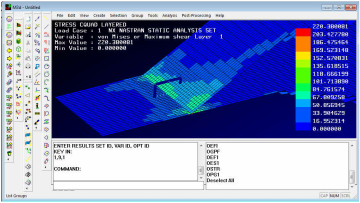
To display the selected results as a contour plot click the 'Post Processing->Contour Raw Results' menu item.
To set the colour bar to a different range click the 'Post Processing->Options->Set Colour Bar' menu item.
In the command line enter the required range for the plot opposite type 0 100
In the command line enter the required range for the plot opposite type 0 100
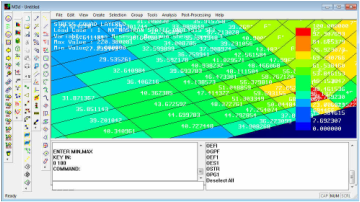
To turn on results labels click the 'Post Processing->Toggle Results Labels' menu item.
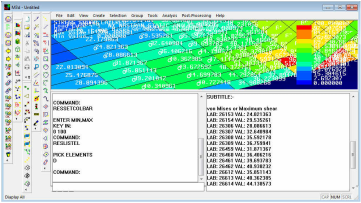
To list element results to the information window select the 'Post Processing->List Element Results' menu item. Then pick the elements to list the results from and enter.
The results will be listed in text format to the information window. These results can then be copied and pasted into other documents
The results will be listed in text format to the information window. These results can then be copied and pasted into other documents
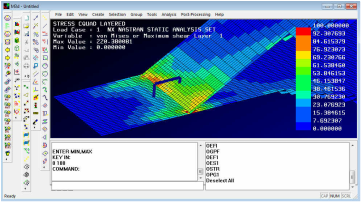
To create a deformed plot click the 'Post Processing->Select Deformed Results' menu item. This bring the results dialog to select the results to deform the model by as shown right.
Select the displacement results set as shown opposite and click ok. Note if you also select one of the TX, TY ,TZ etc fields the plot will deform only in that particular direction leaving the second field blank deforms the model by the full vector displacement magnitude.
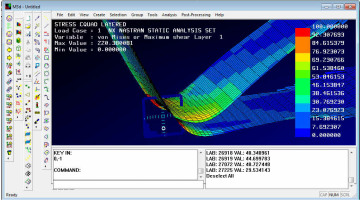
Click the 'Post Processing->Deformed Display' menu item. The deformed plot should now be displayed as shown right
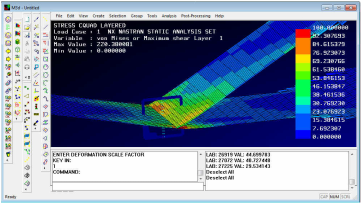
Note presently M3d does quite a bad job of deciding the scale factor to deform the model by.To change the deformation scale click the 'Post Processing->Options->Deformation Scale' menu item. On the command line enter a new scale factor (for this example enter 1) and press okay.
To export all the results to a .CSV file which can be read by EXCEL click the 'File->Export->Export Results to TEXT File' menu item
To be updated:-
This is a quick explanation of how to use the newly added animation display functionality.
1) Results (either deformation or contour must be selected.
Menu Item "Post-Processing->Select Contour Results" or "Post-Processing-> Select Deformed Results"
2) Display the contour and/or deformation plot
Menu Item "Post-Processing->Contour Raw Results" and or "Post-Processing->Deformed Display"
3) Set the deformation scale if unsuitable
Menu Item "Post-Processing->Options->Deformation Scale"
4) Animate the results
Menu Item "Post-Processing->Animate"
5) To stop the animation select "Post-Processing->Animate" once more. Selecting this option toggles on and off the animation.
Most of these options are also available on the "Post" processing tool bar as Icon buttons.
There are several parameter that can be adjusted to enhance the animation. these are
1) Adjust the no of frame (default is 5 frame)
Menu Item "Post-Processing->Animation Frames" and enter the desired no of frames in the command line.
2) Frame delay, this the pause time before the next frame will display (default is 200ms). To enter a new frame delay use
Menu Item "Post-Processing->Frame Delay" and enter a new delay in milli seconds.
3) Animate Negative / Positive will animate the display in both negative and positive directions mainly used for modal display. Selecting this option doubles the no of frames specified for the single direction mode.
Menu Item "Post-Processing->Animate Neg / Pos Tog"